Last November, Sarah — a founder we'd been working with — sent an email at 11:47 PM. The subject: "RE: Production Update — I thought we were past this."
Six weeks earlier, her factory delivered a 32-page DFM report. Color-coded tables. Every item "OK" or "Will modify." Her team reviewed it in one afternoon, signed off, and tooling started two days later.
The factory addressed four of fourteen issues flagged in that report. The other ten became "under review," then "deferred to next revision." When T0 samples arrived with sink marks visible from across the room, those same ten issues showed up as root causes. Mold modification: $23,000. Schedule slip: seven weeks. Her biggest customer invoked force majeure.
Sarah isn't unusual. Out of 127 programs at SciPure, 73% arrived with a signed-off DFM report containing unresolved manufacturing risks. In more than half, the factory had silently deprioritized items that later became production-showstoppers.
A DFM report is not a permission slip. It's what happens after the report that separates startups that ship from ones that burn through runway debugging problems someone should have fixed months earlier.
Month 1: The DFM Resolution Sprint — Weeks 1-4
The first thirty days after DFM receipt are the highest-leverage period in your entire program. Changes here cost hundreds. The same changes after steel is cut cost thousands — sometimes tens of thousands.
At SciPure, we run a Resolution Matrix — each DFM item classified into one of three buckets:
| Bucket | Definition | Example |
|---|---|---|
| Red — Showstopper | Cannot proceed without resolution | Undercut requires $18K slider; material has no qualified supplier |
| Yellow — Schedule Risk | Can proceed but creates downstream risk | Wall thickness 0.3mm above nominal (sink mark likely) |
| Green — Document & Monitor | Acceptable with documented assumption | Cosmetic feature in non-visible area |
Critical rule: No item moves from Red or Yellow to Green without explicit engineering justification, documented in writing, approved by someone accountable.
AI in 2026: CNN+GNN systems now achieve 99.2% PCB defect detection vs. 82% for traditional DRC, cutting review time from 4+ hours to under 12 minutes. Mechanical DFM tools catch ~80% of issues instantly upon CAD upload. Use AI to find problems faster. Use human judgment to make sure someone actually fixes them.
Month 1 Deliverables
- Resolution Matrix — every item classified Red/Yellow/Green with owner and deadline
- All Red items resolved or explicitly accepted with risk mitigation
- Factory acknowledgment of Yellow items with committed timeline
- Updated CAD package reflecting all accepted changes
- Mold flow analysis completed — last chance to catch filling issues
Month 2: Tooling & The Valley of False Confidence — Weeks 5-8
Tooling starts. Money leaves your account. Progress photos arrive. You feel productive. Meanwhile, the most important work happens in the background without anyone managing it.
T0 Sample Preparation Protocol
Before steel is cut, you need a T0 acceptance criteria document — measurable, pass/fail criteria for every critical dimension, functional test point, and cosmetic requirement. T0 samples always have issues. Without pre-defined criteria, you argue about measurement methodology instead of fixing problems.
Component Qualification Parallel Track
While molds are built, electronics need qualification:
- Long-lead-time components ordered (with buffer — 2026 lead times stretch 20-30%)
- Alternate suppliers identified and samples obtained
- First article inspection (FAI) protocols defined
- IQC specifications locked
Tariff context July 2026: Section 301 duties 7.5-100%, effective average 19-22% for consumer electronics. The USTR's July 24 deadline for overcapacity investigation (16 economies) means additional action could come fast. Single-source components = concentrated exposure.
The Silent Killer: Communication Drift
Weekly calls become bi-weekly. Bi-weekly become email threads. Email threads become assumptions. Programs with weekly structured check-ins hit PVT targets 64% more often.
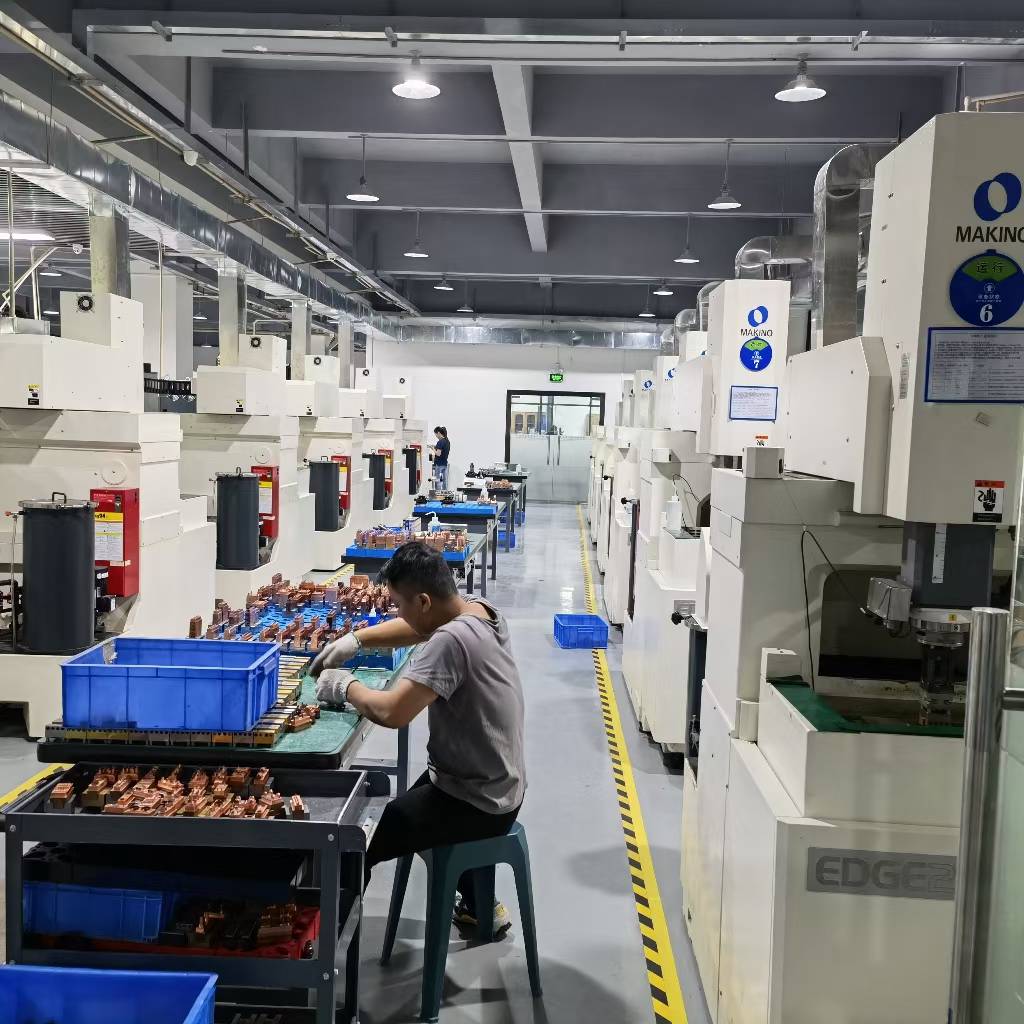
Precision tooling in progress — where Month 2 decisions determine Month 4 outcomes
Month 3: The Valley of Adjustment — Weeks 9-12
T0 samples arrive. They're never right. How wrong they are — and how fast you iterate — determines everything.
| Issue Type | Cause | Fix Approach | Typical Cost |
|---|---|---|---|
| Design-originating | Original CAD was wrong | Modify steel / redesign | $5K-$50K+ |
| Process-originating | Process needs tuning | Adjust parameters, retrain | $500-$5K |
Design-originating issues at T0 = process failure, not manufacturing surprise. They should have been caught in Month 1.
Three Derailment Scenarios
- The Infinite T-Loop: T0 → fix → T1 → new issues → T2 → original issues return. Recovery: Stop iterating. Go back to Resolution Matrix.
- The Scope Creep Cascade: "While we're modifying the mold, let's also add this feature..." Each addition = 2-4 weeks + $3K-$15K. Recovery: Freeze scope at T0. New features = Phase 2.
- The Certification Surprise: "FCC testing takes 6 weeks and our enclosure fails radiated emissions." EU Cyber Resilience Act fines up to €15M. Recovery: Engage cert lab immediately. Accept the delay.
Month 4: The Runway to Production — Weeks 13-16
Everything converges. The question: Can our factory — using actual operators, actual equipment — consistently produce units that meet spec, at target cycle time and cost, day after day?
PVT Framework
Phase 1: Pilot Run (50-200 units) — Full production line, target >90% FPY.
Phase 2: Process Validation (200-500 units) — Cpk ≥ 1.33 for all critical dimensions.
Phase 3: Shipping Validation — ISTA drop-test, final AQL sampling.
| Metric | Minimum | What Failure Means |
|---|---|---|
| First-pass yield | >95% | Cost and capacity impact; investigate before scaling |
| Critical dimension Cpk | ≥1.33 | Process not capable; don't scale until stable |
| Cosmetic defect rate | <1% | Brand reputation risk |
| Functional test pass | >99% | Reliability concern; field returns expensive |
| Packaging integrity | 100% ISTA | Shipping damage = return disaster |
Proceeding to mass production with unresolved PVT issues is the single highest-risk decision in hardware development.
Decision Framework: Where Are You?
| Your Situation | Approach | Timeline |
|---|---|---|
| Pre-seed, first product, <500 units | Rigorous Months 1-2; bridge tooling acceptable | 10-14 weeks DFM→shipment |
| Seed/Series A, 2nd+ product, 2K-10K | Full 4-month framework; don't skip PVT | 14-20 weeks |
| Series B+, 10K+ units | Full framework + AI vision + dual sourcing + PPAP | 16-24 weeks |
The Principle
A DFM report without an execution timeline is just an opinion. A timeline without DFM-driven milestones is just a wish. The bridge between them is called ownership — and it's the single factor that separates the hardware startups that ship from the ones that burn through their runway debugging problems that someone should have fixed four months earlier.
Sarah's second product? Same factory. Same team. Different process: Resolution Matrix with named owners. Weekly check-ins. T0 criteria written before steel was cut. Shipped eleven days ahead of schedule. Defect rate: 1.1%. Retailer reordered at 40% higher volume.
Need help bridging the DFM-to-production gap? Send us your DFM report for a free Resolution Matrix assessment.
Published: July 20, 2026 | Category: DFM Execution & NPI Process
Comments (3)
The Resolution Matrix is exactly what we needed. We just found three Red items in our DFM that the factory had quietly moved to "Green — acceptable risk" without justification. Caught them before tooling started. This framework paid for itself in the first hour.
The "Valley of False Confidence" in Month 2 perfectly describes our last project. We felt productive because tooling was moving — while our component qualification sat untouched for three weeks. Cost us a 6-week delay when our sole-source MCU went on allocation. Never again.
We implemented the PVT go/no-go framework from this article. First PVT attempt: 87% FPY. We said "no" — stopped, found the root cause (inconsistent gate temperature), fixed it. Second PVT: 96.2% FPY. Our factory was surprised we held the line. Best manufacturing decision we've ever made.
Leave a Comment